REITs To The Rescue
- This article is my second in a series.
- Its purpose is to assist members in building a REIT portfolio from the ground up – even in these perilous times.
- I hope you enjoy reading it. And please let me know if you have any comments, questions, or suggestions.
In Part I of “How the Pandemic Changed Real Estate for the Better and the Worse,” I concluded with this:
“Over the past 10 years or so, the REIT [real estate investment trust] sector has grown rapidly, as many new companies have listed and/or expanded…
“As I pointed out in my new book, The Intelligent REIT Investor Guide, U.S. equity REITs own roughly 10% of all institutional-quality commercial real estate, which means the REIT sector has enormous potential.
“… the U.S. equity REIT sector has a market capitalization of just over $1.4 trillion.
“… [and] equity REITs have outperformed the S&P 500, [Russell 2000], Nasdaq, and… DJIA [in] 1972-2022, returning an average of 11.38% annually.”
In other words, there are many compelling reasons to expect the larger category to grow from here. I outline them often on iREIT in general, and my confidence hasn’t changed.
However, I also mentioned that:
“… the story isn’t yet settled surrounding the pandemic.
“We’re still debating whether there can be a return to ‘normal’ or whether the ‘new normal’ is here to stay. Which begs for some commentary.”
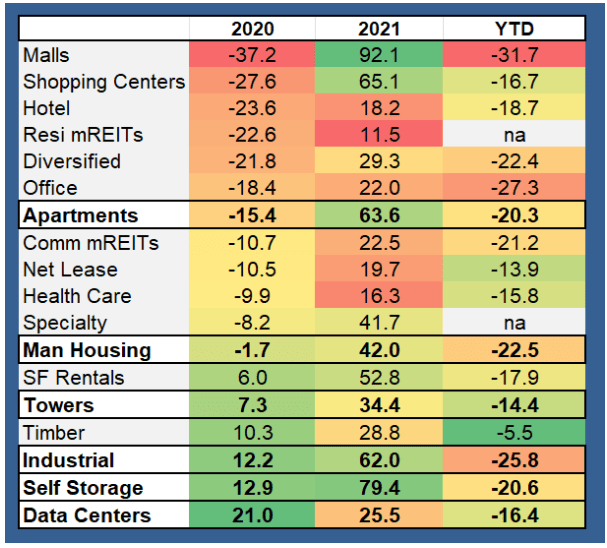
That’s why I first covered “sectors that are performing for the better,” such as apartments, manufactured housing, and self-storage. Also mentioned were cell tower REITs, data centers, and industrials – the “tech trifecta,” as I like to call those latter three.
Not only did most of them perform well during the shutdowns… they’ve got great prospects going forward too. What’s not to like!
Reevaluating REIT Reality These Two Years Later
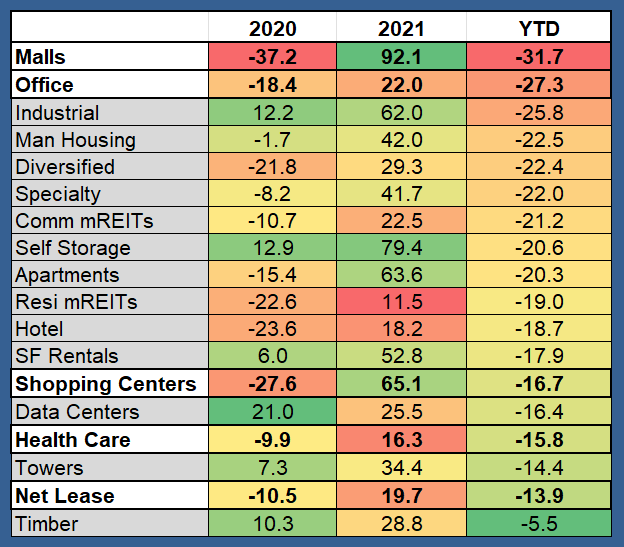
Again, though, that was “How the Pandemic Changed Real Estate” Part I. This is Part II, which – as I explained in the previous post’s comment section – “will address office, retail (malls/shopping centers), healthcare, net-lease, and hotels.”
These are “all sectors that could see downward pressure, especially the urban office sector and malls.”
Part of that commentary might come as a surprise to you considering how hard I fought to convince everyone of the value of New York City REITs in 2020 and 2021.
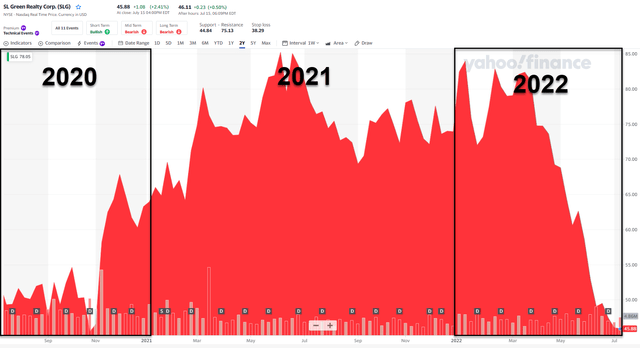
Take my June 28, 2020, article titled, “SL Green Realty: An Upgrade for NYC’s Largest Office Landlord.”
“We must critically evaluate both sides of the coin before determining [SL Green’s (SLG)] value. Although a volatile market, SLG’s Manhattan occupancy remains near 95%. Rent collections, including last month, have remained [around 90%] at the portfolio level. Retail rent collection has suffered, but it remains above 50%. And that segment is less than 15% of contractual rent. It is essential to keep these facts in mind as we critique the balance sheet and local economy.”
And I concluded with:
“SLG has its fair share of challenges, but the market is cognizant of this. SLG’s stock has traded lower than current levels only for a brief period during the trough of the Great Recession… [which] was driven by weakness in financial services and excess leverage in commercial real estate.
“… we believe SLG currently offers a convincing opportunity for those interested in exposure to one of the most valuable, liquid, and popular commercial real estate markets.”
As such, I upgraded “SLG from a Hold to a Strong Spec Buy” while still mentioning that: “The real question is not 2020… but rather 2021 and beyond.”
Well, we’ve reached “beyond.” So what do we think today?
We Want to Stay on Top of the Ever-Changing Real Estate Game
Today, SL Green remains a Speculative Buy – though not as strong. The REIT did go on to recover its share price, though it’s since dropped off from there.
Believe me, I’m monitoring it.
In fact, that’s my point. While I monitor all my positions and recommendations, there are some you can sleep well at night (SWAN) with…
Then there are others that need us to take extra precautions.
That’s what I’m saying about these next categories. They could do very well from here. But they’re not positions we’re over-weighting at this time.
Now that we’re in July 2022, we don’t have to live with shutdowns anymore. And I think it’s safe to say most people aren’t wearing masks either. (Though I did see a lady wearing one at the gym yesterday.)
However, again, “the story isn’t yet settled surrounding the pandemic.” That includes with the ongoing work-from-home phenomenon – which has now turned into a tug of war.
There was an article recently about several hundred Virginia state employees quitting because they were told to come into the office or else. So they “or elsed.”
I’m not calling for the death of the office altogether, mind you, like so many were back in 2020. I maintain that’s ridiculous. Though I’ll flat out remind you I was wrong about my calls for the death of gyms back then.
In short, the situation has changed to some degree and in some ways. And it hasn’t changed to some degree in other ways.
So let’s see what exactly that means with our next round of subsectors we want to evaluate.
Office REITs
As already mentioned, office REITs are in somewhat of a tug-of-war. So we want to focus on the highest-quality, best-situated assets outperforming…
Those with the best balance sheets, modest floating-rate debt, and well-laddered maturities.
It’s interesting to see the bifurcation of urban (e.g., New York City, Chicago, San Francisco) and Sunbelt (e.g., Charlotte, Atlanta, southern Florida, Austin, Dallas, Phoenix) markets concerning work-from-home policies.
Overall, NYC appears the most aggressive, with many of the largest employers asking for three days per week. But Sunbelt companies can take advantage of the fact that most of their employees have an easy commute.
The West Coast is at the lower end, especially in the Bay Area.
I’m also including life sciences in our office sector coverage instead of with healthcare. It’s widely known that leasing there has slowed, especially for smaller tenants.
Then again, Alexandria Real Estate Equities (ARE) recently said it expects no changes to its 2022 guidance or business plan.
Overall U.S. leasing volume increased to 47 million square feet in Q1-22, up 5.4% over Q4-21. Albeit Q1 was a seasonally slow quarter, with REITs leasing close to 2019 levels.

As you can see above, our office picks are:
- SL Green (SLG)
- City Office (CIO)
- Highwoods Properties (HIW)
- Boston Properties (BXP)
- Kilroy Realty (KRC)
- Easterly Government (DEA).
We included the payout ratios for each REIT using adjusted funds from operations (AFFO). That provides a much better snapshot of the safety of the dividend.
In that regard, SLG, CIO and DEA are approaching a dangerous distribution level.
Our top picks in the subsector include HIW, with its low 60% payout ratio and extremely cheap 8.6x FFO multiple. We also like KRC, with its overall lowest payout ratio and promising forward-looking growth profile.
And ARE and BXP are also worth a look.
Retail REITs
Much like offices, the retail subsector has also seen a bifurcation between urban and suburban categories. Specifically concerning malls, you may recall “The Mall Conundrum,” an article I published in 2019, where I explained:
“I have been [sounding] the alarm bells for the B/C mall REITs for quite some time. As I mentioned above, I drive by my area mall daily (owned by CBL) and it’s a constant reminder that death is inevitable when there is no competitive advantage.”
And I added:
“There are hardly any malls being constructed in the U.S., and this means that the only way for the REITs to grow is to either 1) grow organically, 2) redevelop, 3) invest internationally, or 4) acquire other malls or mall REITs. And without adequate cost of capital, options 2, 3, and 4 are almost impossible.”
Here’s what happened since:
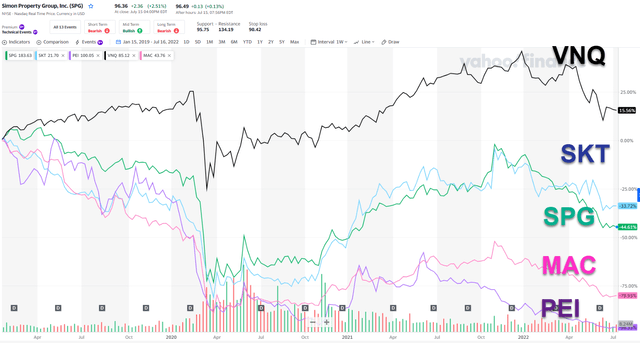
Fortunately, iREIT was underweight malls leading into the pandemic. Yet we did have some positions.
Our primary reason for that modest exposure going into 2020 was the excess of both department stores and malls in the U.S.
Even these days, the only two mall REITs we’re recommending are Simon Property Group (SPG) and Tanger Factory Outlet (SKT). Both have solid AFFO-based payout ratios.

We’re much more bullish about shopping centers, since all those REITs raised guidance in Q1-22 on stronger-than-expected demand. However, for Q2 earnings, we expect them to take a more conservative view given:
- Weakening consumer capabilities
- Inflationary forces
- Continued supply chain disruptions.
Overall, we expect shopping-center REITs to focus on the strength of Sunbelt exposure and grocery-anchored centers. Elsewhere, the pace of retail closures will likely accelerate in 2022.
(Read my recent Kohl’s article here.)
Retail REITs Continued
Looking at their performance from January 2019, you can see most have underperformed. Vanguard Real Estate Index Fund (VNQ) – the black line – and Kimco (KIM) are the only names that have outperformed.
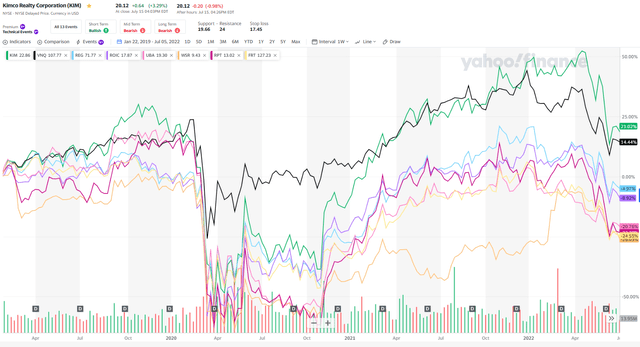
Yet we still see strength in the shopping-center business model. Q1-22 results highlighted robust leasing demand and strong leasing volume.
In fact, most all REITs delivered beats and increased guidance.
FY-22 guidance implies a weighted average year-over-year FFO growth of roughly 6.3% for strip malls and 2.3% for malls.

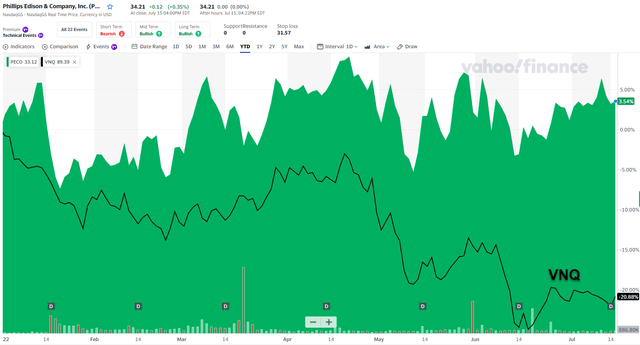
All the retails above are on our buy list – minus Phillips Edison (PECO), which is trading 1% above our Buy Below target. We previously recommended PECO as one of our top picks in 2022 and shares have outperformed, as shown below.
We’ve also been bullish with regard to RPT Realty (RPT). It remains attractive based on a low P/FFO of 10.2x and AFFO-per-share payout ratio of just 67%.
RPT is expected to grow around 9% in 2022.
Now, Federal Realty (FRT) – the only divided king in the REIT sector – does have an elevated payout ratio of 100%. We suspect it’s still a bit wobbly from its non-retail investments, namely its office and hotel exposure.
Turning to Urstadt Biddle (UBA), we like its demographic profile in suburban markets outside NYC and cheap valuation at 11.8x P/FFO.
Although not on our shopping-center list, CTO Realty (CTO) is also worth watching. We recommended it as a C-Corp and then again in 2020 during the pandemic after it converted to a REIT.
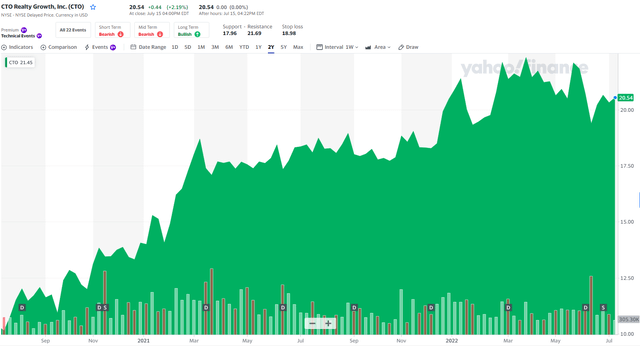
We still see some meat on its bone since shares are trading at $20.25 with a very attractive 7.4% yield. Its dividend payout ratio is 85% – and improving based on its exceptional growth profile (shown below).

Net-Lease REITs
With the market focused on tightening monetary conditions and an increasing recession risk… we believe more defensive net-lease REITs will outperform.
I’ve owned these companies for around a decade – and developed free-standing properties for over two decades prior to that period. Owning a core position in them has served me well.
Just look at Agree Realty (ADC), Realty Income (O), and W. P. Carey(WPC), which are all outperforming.
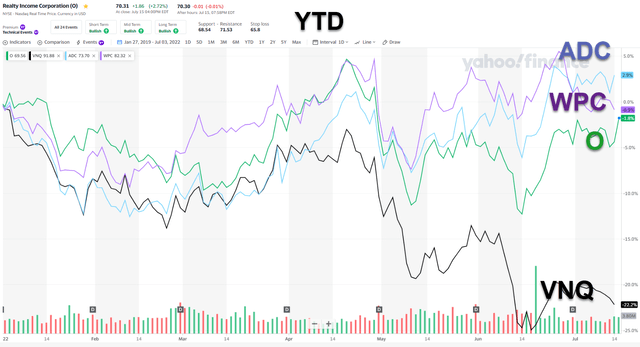
There were also three that launched in 2020: NETSTREIT (NTST), Alpine Net Lease (PINE) and Broadstone Net Lease (BNL). Admittedly, they’ve underperformed:
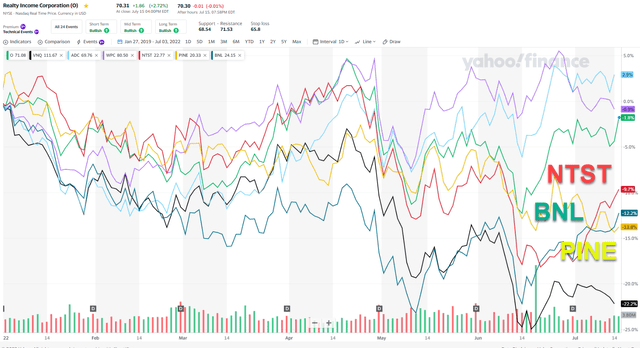
At iREIT on Alpha, we’re watching cost of capital closely, as it’s increased for all REITs – some higher than others. This means investment spreads are narrowing.
We’re also fixated on more merger and acquisition (M&A) possibilities even after:
- Realty Income bought up VEREIT.
- VICI Properties (VICI) rolled up MGP.
We view Spirit Realty (SRC) and Four Corners (FCPT) as strong takeout targets. And Getty (GTY) could be swooped up by the likes of Essential Properties (EPRT) or STORE Capital (STOR).
Overall, though, WPC seems best-positioned to raise guidance with Q2-22 results. We think it will revise guidance to reflect the expected close of its CPA:18 acquisition.

Unfortunately, it’s not on our buy list because shares are trading above our target. Agree Realty (ADC) just passed that mark last week too. (See my recent article on ADC here.)
Four of the nine net-lease REITs above are Strong Buys:
- Spirit Realty, yielding 6.4%
- Essential Properties, yielding 7.3%
- STORE Capital, yielding 5.7%
- NETSTREIT, yielding 4.1% – with superior growth forecasted in 2022.
That’s what we’ve got there!
Healthcare REITs
Within the healthcare subsector, there are many ways to deploy capital. But we most like senior housing, medical office building, and hospitals.
For senior housing, Welltower (WELL) and Ventas (VTR) reported 500 basis-point and 400 bps increases, respectively, in year-over-year occupancy in Q1-22. They achieved strong moves in rates and record demand.
Skilled nursing, meanwhile, has improved year-to-date with an average 400 bps per month of sequential occupancy growth. Over the past month then, occupancy:
- Rose 140 bps for CareTrust (CTRE)
- Rose 90 bps for LTC Properties (LTC)
- Dropped 5 bps for WELL
- Dropped 320 bps for Sabra (SBRA).
Although the worst has likely passed for skilled nursing REITs, uncertainty remains. That’s thanks to fading government support, regulatory pressures, and a looming Medicare and Medicaid rate cut.
Given these risks, we prefer medical office buildings over them.
As per Q1-22 REIT data, CTRE had the most skilled nursing facility exposure at 86% of net operating income (NOI). OHI was at 74%, SBRA at 62%, LTC at 35%, NHI at 32%, and WELL at 5% (excluding ProMedica 10%).
We’re also watching the cost of capital closely and tend to favor higher-quality names with better balance sheets. Medical Properties (MPW) remains an attractive outlier, for one, since shares are beaten down due to its Steward tenant exposure and negative media reports.

As shown above, Physicians Realty (DOC) and Omega Healthcare (OHI) have elevated AFFO-per-share payout ratios. While they are on the recommended list, we don’t expect any dividend growth in 2022 or 2023.
Global Medical (GMRE), then, is an interesting small-cap pick at just $708 million. Its dividend yield is 7.6% and its payout ratio is 82%.
AFFO per share is expected to grow by 9% in 2022 and 2023.
CareTrust (CTRE) with its $1.8 billion market cap is another smaller name worth checking out. Its dividend yield is 5.8%, and it has one of the overall lowest payout ratios at 74%.
Our most defensive pick is Ventas Inc., which yields 3.5% with a sound 67% payout ratio.
With that said, although somewhat riskier… MPW is the most tempting name among them with its 7.4% yield. You can see my latest MPW article here.
Really… It’s REITs to the Rescue
This article concludes my two-part series titled, How the Pandemic Changed Real Estate For The Better And The Worse.
Down below, you’ll find my recommendation for all REITs discussed, as sorted by dividend safety (the middle column).
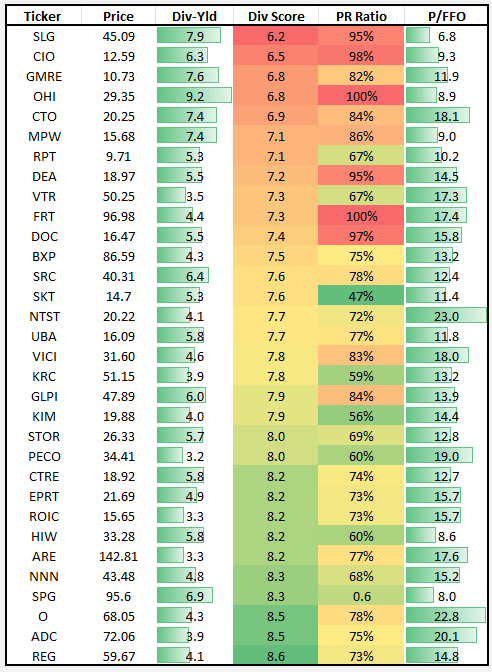
Next, I put together a consolidated list of everything referenced in this series, sorting by their dividend safety scores.
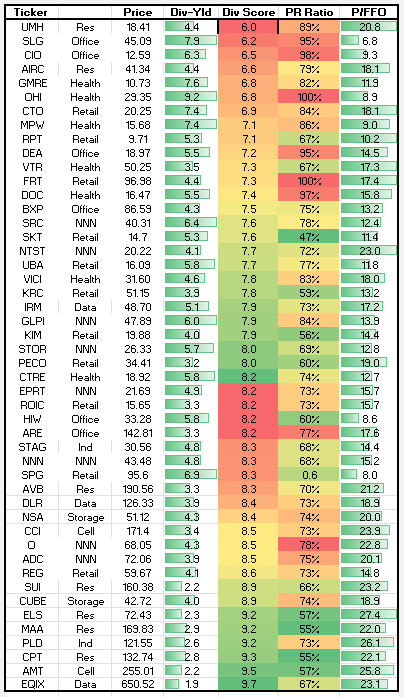
But I didn’t stop there. Taking from those 48 REITs, I next compiled 20 that look most promising toward building a portfolio from scratch.
Over the past 90 days, we’ve seen record growth at iREIT on Alpha. So we thought this would be an opportunistic time to build a new basket of REITs – recognizing that there are many variables at play right now:
- Inflation
- Rising rates
- The war in Ukraine
- A lot of fear in the market.
We’ve found that most investors own around 20 REITs in their portfolio. And the 48 I provided offer a very good pool to pick from.
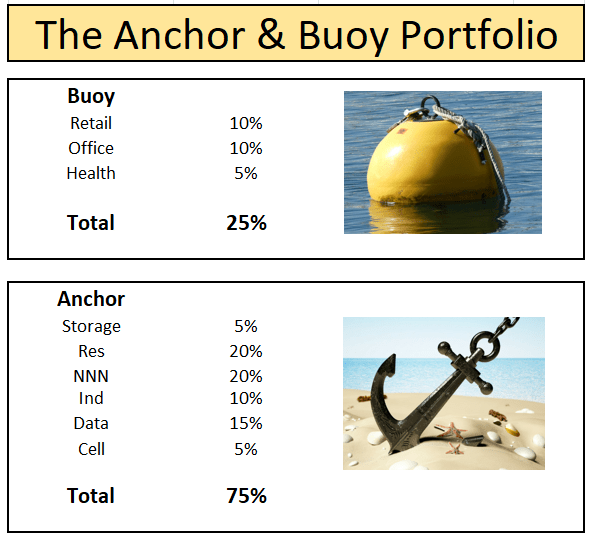
Of course, you must determine whether or not you want to take on added risk in retail, office, and healthcare. We recommend taking a strategic “Anchor & Buoy” approach using both defensive (anchors) and deep-value (buoy) sectors.
Overall, we see the sector as being well positioned versus other industries – where the market seems to be more concerned over downward guidance revisions, margins, too-high Street estimates, and/or cautious commentary.
For Q2 earnings, we expect positive commentary and solid results since demand remains strong in most REIT subsectors.
But again… anchor your portfolio with categories that promise optimal pricing power:
- Industrial
- Residential
- Self-storage
- Technology (data and towers)
- Net-lease.
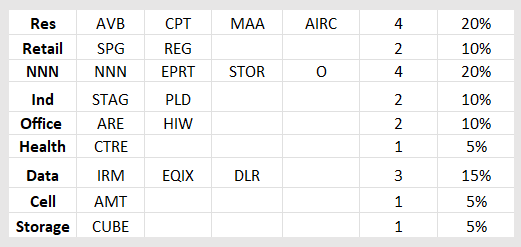
As such, our Anchor & Buoy model looks like this:
The Anti-Inflation Picks
Next up, let’s consider a list of REITs that fit in our new inflation-inspired portfolio. It involves the highest-quality names selected through our dividend safety scoring model.
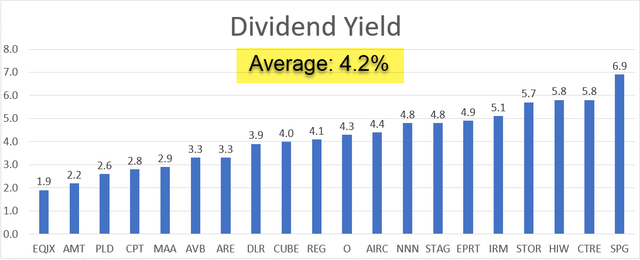
We recognize that many retirees are interested in the growing income that this portfolio generates. The average dividend yield for these 20 REITs is 4.2%.
However, we can also make a strong case for dividend growth. We know the secret to superior total return performance isn’t only a safe dividend, but a growing dividend.
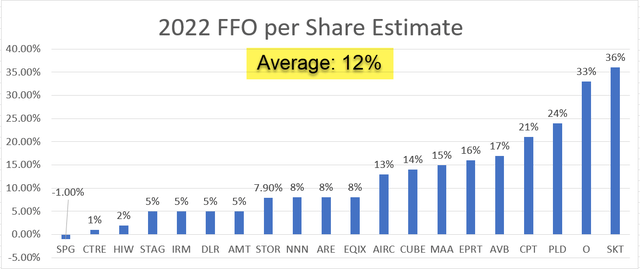
The above chart includes the average FFO-per-share consensus estimate for all 20 REITs in the Anchor & Buoy basket. Their average growth is 12%.
Of course, we recognize that estimates are just that: estimates. However, we’d be very happy to see their average dividend grow by “just” 10% year-over-year.
Remember, we’re not just looking for a high-yield portfolio. We’re looking for a basket of the highest-quality REITs anchored by the most defensive names in their universe.
Now is an excellent time to cast your net and utilize this portfolio – or a similar one – to build a safe and reliable basket of income stocks.
In Conclusion…
Keep in mind that we’re in the process of refining our portfolios at iREIT on Alpha. This is just one of the first steps toward our goal of simplification.
Many of you have asked us for a new basket of REITs and a blueprint designed for current times. And I enjoy giving such questions such solid answers.
Our next goal is to build a high-yield basket. Obviously, it won’t generate the same kind of growth as the Anchor & Buoy” portfolio. Not when we’ll be incorporating some riskier REITs like:
(For the record, I’m working on a commercial mortgage REIT, or mREIT, article this week.)
It’s important that investors always recognize their personal risk tolerance limitations regardless. That’s the primary reason behind our portfolio simplification efforts.
We want to make sure that we can accommodate every risk profile. And this “Anchor & Buoy” model is our first step toward that goal.
I hope you enjoyed this two-part series. Later this week, we’ll provide more content regarding the portfolios and announcing our portfolio managers.
We’re always looking to improve our research. So I want to thank all of you for your input and suggestions.
It makes a difference!