2022 Dividend Aristocrats List | Updated Daily | All 65 Analyzed
The Dividend Aristocrats are a select group of 65 S&P 500 stocks with 25+ years of consecutive dividend increases.
They are the ‘best of the best’ dividend growth stocks. The Dividend Aristocrats have a long history of outperforming the market.
The requirements to be a Dividend Aristocrat are:
- Be in the S&P 500
- Have 25+ consecutive years of dividend increases
- Meet certain minimum size & liquidity requirements
There are currently 65 Dividend Aristocrats. You can download an Excel spreadsheet of all 65 (with metrics that matter such as dividend yields and price-to-earnings ratios) by clicking the link below:
Click here to download your Dividend Aristocrats Excel Spreadsheet List now.
Note: On January 24th, 2022 Brown & Brown (BRO) and Church & Dwight (CHD) were added to the Dividend Aristocrats Index, while AT&T (T) was removed. Also, People’s United (PBCT) was acquired, leaving 65 Dividend Aristocrats.
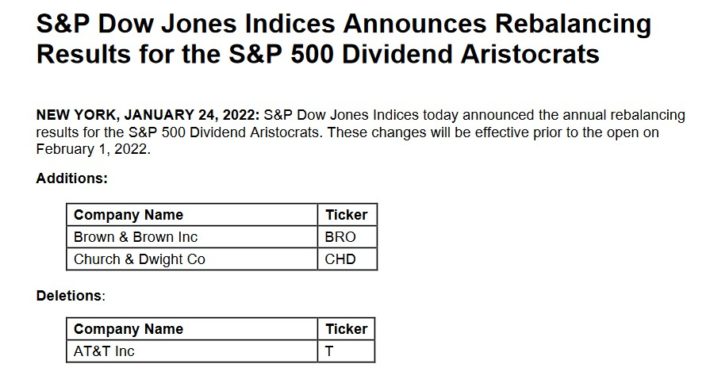
Source: S&P News Releases.
You can see detailed analysis on all 65 further below in this article, in our Dividend Aristocrats In Focus Series. Analysis includes valuation, growth, and competitive advantage(s).
Table of Contents
- How To Use The Dividend Aristocrats List To Find Dividend Investment Ideas
- Performance of the Dividend Aristocrats
- Sector Overview
- The Top 7 Dividend Aristocrats Now
- Dividend Aristocrats Analysis (The Dividend Aristocrats In Focus Series)
- Historical Dividend Aristocrats List (1989 – 2022)
- Final Thoughts
How to Use The Dividend Aristocrats List To Find Dividend Investment Ideas
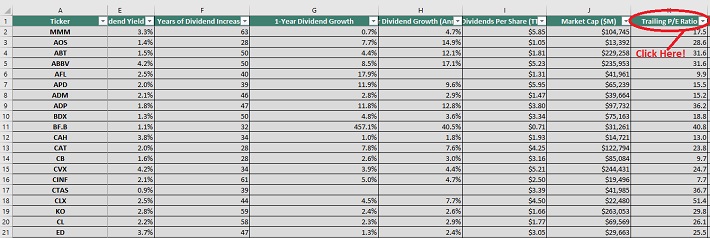
The downloadable Dividend Aristocrats Excel Spreadsheet List above contains the following for each stock in the index:
- Price-to-earnings ratio
- Dividend yield
- Market capitalization
All Dividend Aristocrats are high-quality businesses based on their long dividend histories. A company cannot pay rising dividends for 25+ years without having a strong and durable competitive advantage.
But not all Dividend Aristocrats make equally good investments today. That’s where the spreadsheet in this article comes into play. You can use the Dividend Aristocrats spreadsheet to quickly find quality dividend investment ideas.
The list of all 65 Dividend Aristocrats is valuable because it gives you a concise list of all S&P 500 stocks with 25+ consecutive years of dividend increases (that also meet certain minimum size and liquidity requirements).
These are businesses that have both the desire and ability to pay shareholders rising dividends year-after-year. This is a rare combination.
Together, these two criteria are powerful – but they are not enough. Value must be considered as well.
The spreadsheet above allows you to sort by trailing price-to-earnings ratio so you can quickly find undervalued, high-quality dividend stocks.
Here’s how to use the Dividend Aristocrats list to quickly find high-quality dividend growth stocks potentially trading at a discount:
- Download the list
- Sort by ‘Trailing PE Ratio,’ smallest to largest
- Research the top stocks further
Here’s how to do this quickly in the spreadsheet:
Step 1: Download the list, and open it.
Step 2: Apply a filter function to each column in the spreadsheet.
Step 3: Click on the small gray down arrow next to ‘Trailing P/E Ratio’, and then sort smallest to largest.
Step 4: Review the highest ranked Dividend Aristocrats before investing. You can see detailed analysis on every Dividend Aristocrat found below in this article.
That’s it; you can follow the same procedure to sort by any other metric in the spreadsheet.
This article examines the characteristics and performance of the Dividend Aristocrats in detail. Click here for a table of contents for easy navigation of this article.
Performance Through May 2022
In May 2022, the Dividend Aristocrats, as measured by the Dividend Aristocrats ETF (NOBL), registered a positive 0.30% return. It outperformed the SPDR S&P 500 ETF (SPY) for the month.
- NOBL generated total returns of 0.30% in May 2022
- SPY generated total returns of 0.22% in May 2022
Short-term performance is mostly noise. Performance should be measured over a minimum of 3 years, and preferably longer periods of time.
The Dividend Aristocrats Index has slightly underperformed the broader market index over the last decade, with a 14.15% total annual return for the Dividend Aristocrats versus 14.40% for the S&P 500 Index.
The Dividend Aristocrats have exhibited lower risk than the benchmark, as measured by standard deviation. This has led to stronger risk-adjusted returns for the Dividend Aristocrats relative to the broader market in the past 10 years.
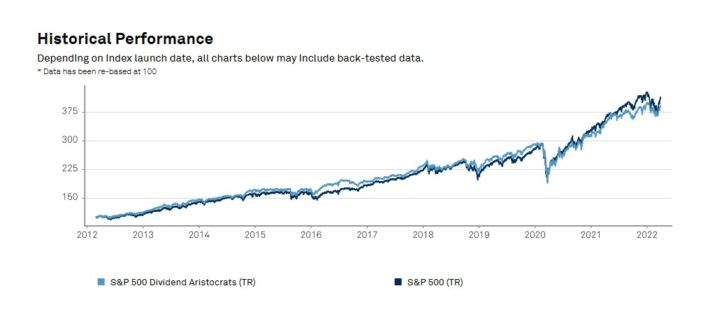
Source: S&P Fact Sheet
Higher total returns with lower volatility is the ‘holy grail’ of investing. It is worth exploring the characteristics of the Dividend Aristocrats in detail to determine why they have performed so well.
Note that a good portion of the outperformance relative to the S&P 500 comes during recessions (2000 – 2002, 2008). Dividend Aristocrats have historically seen smaller drawdowns during recessions versus the S&P 500. This makes holding through recessions that much easier. Case-in-point: In 2008 the Dividend Aristocrats Index declined 22%. That same year, the S&P 500 declined 38%.
Great businesses with strong competitive advantages tend to be able to generate stronger cash flows during recessions. This allows them to gain market share while weaker businesses fight to stay alive.
The Dividend Aristocrats Index has beaten the market over the last 28 years…
We believe dividend paying stocks outperform non-dividend paying stocks for three reasons:
- A company that pays dividends is likely to be generating earnings or cash flows so that it can pay dividends to shareholders. This excludes ‘pre-earnings’ start-ups and failing businesses. In short, it excludes the riskiest stocks.
- A business that pays consistent dividends must be more selective with the growth projects it takes on because a portion of its cash flows are being paid out as dividends. Scrutinizing over capital allocation decisions likely adds to shareholder value.
- Stocks that pay dividends are willing to reward shareholders with cash payments. This is a sign that management is shareholder friendly.
In our view, Dividend Aristocrats have historically outperformed the market and other dividend paying stocks because they are, on average, higher-quality businesses.
A high-quality business should outperform a mediocre business over a long period of time, all other things being equal.
For a business to increase its dividends for 25+ consecutive years, it must have or at least had in the very recent past a strong competitive advantage.
Sector Overview
A sector breakdown of the Dividend Aristocrats Index is shown below:
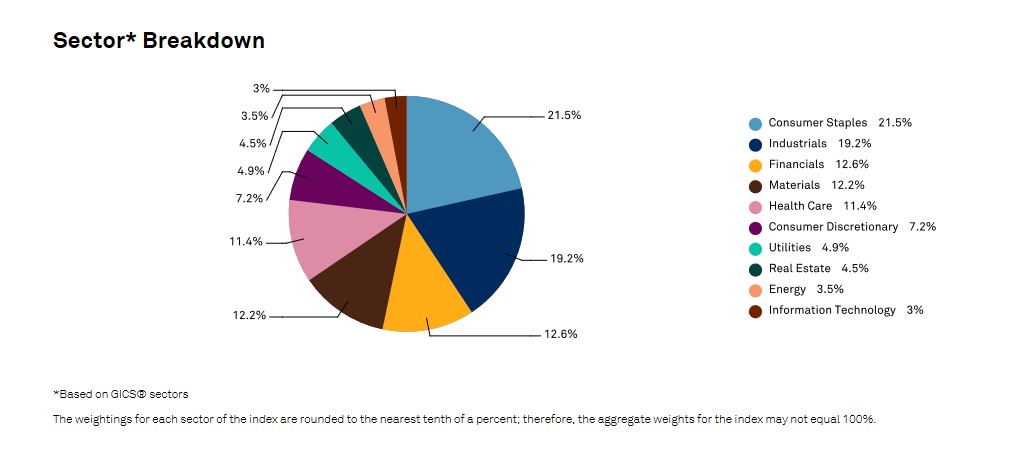
The top 2 sectors by weight in the Dividend Aristocrats are Industrials and Consumer Staples. The Dividend Aristocrats Index is tilted toward Consumer Staples and Industrials relative to the S&P 500.
These 2 sectors make up over 40% of the Dividend Aristocrats Index, but less than 20% of the S&P 500.
The Dividend Aristocrats Index is also significantly underweight the Information Technology sector, with a 3% allocation compared with over 20% allocation within the S&P 500.
The Dividend Aristocrat Index is filled with stable ‘old economy’ blue chip consumer products businesses and manufacturers; the 3M’s (MMM), Coca-Cola’s (KO), and Johnson & Johnson’s (JNJ) of the investing world.
These ‘boring’ businesses aren’t likely to generate 20%+ earnings-per-share growth, but they also are very unlikely to see large earnings drawdowns as well.